What is a Production Facility Architecture ?
 |
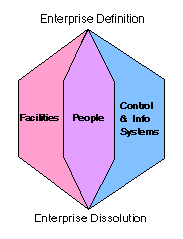
The Production Facility
Architecture is one of three basic components of any enterprise (the
other two are the People/Organizational, and the Control and Information
Systems Architectures.)
The term "architecture", as used in this website, refers not only to bricks and mortar structures, but the structure via which material and data move through maufacturing facililites and organizations.
|
The Production Facilities of an enterprise may be represented
by a series of "Architecture" diagrams, beginning with the Process Flow
Diagrams, Material Flow Diagrams, and Physical Architecture Drawings.
The Architecture of continuous processing facilities (like oil
refineries) are described with "Process Flow Diagrams" (PFDs), while
discrete manufacturing facilities (like parts assembly plants) are
described wtih Material Flow Diagrams (MFDs). These tools enable
engineers to visualize the "architecture" of automated facilities for
the processing of fluids and discrete objects in much the same way that
architectural drawings do for buildings and other "static" structures.
At the next level of detail below the PFD or MFD, the P&ID
(Piping and Instrumentation Diagram) provides a schematic
representation of the processing equipment, piping, instrumentation,
and storage (e.g. tanks), and how these are connected. The P&ID
also shows how instrumentation and control devices (like automated
valves) are connected in "control loops" to effect regulatory contol of
the process units. Thus, the P&ID provides a unique
visualization tool, in that it represents both process equipment from
the Production Facility Architecture, and the lower levels of the
Control and Information Architecture.
FROM OTHER PAGE:
The Architecture
of a Production Facility may be
represented in various forms, depending on the nature of the Physical
Plant. The simplest example is an architectural drawing of a building
where people may carry out some service function. More complex
facilities such as a continuous Process Plant (like an Oil Refinery)
are represented by Process Flow Diagrams (PFDs), while Discrete
Manufacturing Plants (like an automotive assembly plant) may be
represented by Material Flow Diagrams (MFDs). Variations on these and
other formats have been developed to represent the physical production
facilities for most other industry sectors.
A key development in the design of physical
architectures and production facilities was the ability to do
quantitative analysis. Initially this took the form of calculation of
static loads in structures and equipment. This quantification allowed
the evolution from load bearing walls designed by trial and error
(whose pinnacle was the medieval cathedral) to modern structures of
glass and steel. Quantitative modelling also made possible design of
more complex and efficient machines. |
Later, the ability to do quantitative modelling was
extended to the flow of materials. Although some design of production
facilities (like oil refineries or automotive manufacturing) was
possible with manual calculations, it was the invention of the digital
computer that really made it possible to optimize designs. |
The increasing complexity if these facilities made graphical
representation of the production facility essential. To this end, a
number of graphical visualization tools were invented, including PFDs
(Process Flow Diagrams) for continuous process industries, and MFDs
(Material Flow Diagrams) for discrete manufacturing industries. Other
industries required different formats to represent their production
facilities such as "Sequence Diagrams" for batch-oriented production
operations, or "Time and Motion Diagrams" for service industries, etc.
Industry-specific facility architecture diagrams are discussed at more
length in the "Physical Architectures" section of this web site.
Finally, with the advent of even better computers and software
modelling techniques, it became possible to "dynamically" model the
production facility. This made it possible to predict "feedback"
effects such as instability due to recycle of material, cyclical
bottlenecking, etc. A large number of software products are available
to do "steady state" modelling, and a smaller number capable of
"dynamic" modelling. However, these products tend to be
industry-specific, and limited to only one or two phases of the
enterprise life-cycle. These are therefore discussed at more length
under the "Products" area of this website for each specific industry
and enterprise phase.
As the enterprise evolves through each phase, the information
in a facility architecture diagram is expanded to the next level of
detail. Process Flow Diagrams are expanded to produce P&IDs
(Piping and Instrumentation Diagrams), MFDs are expanded to produce
M&IDs (Mechanical and Instrumentation Diagrams. and so on,
until the actual facility is built from detail engineering documents
such as 3D layouts, wiring diagrams, etc. This process of development
is described in more detail in the Engineering Tools area of this
website. After commissioning, these diagrams are maintained to document
the "as built" status of the production facility.
by Gary Rathwell
© reserved
Back
to PERA Home Page
